WEB APP DASHBOARD
2023

CREDIX
DASHBOARD

Redesigning a financial platform for greater control, clarity and trust

My Role

UI/UX Designer (UI-focused)

Plataform

Web App · Financial Dashboard
Scroll to case study
THE CHALLENGE

The Problem

The platform had a high administrative burden

Financial information lacked clarity and readability
The dashboard needed to serve both internal users and clients
Data presentation had to convey trust and reliability

The Project Goal

Redesign the Credix dashboard to simplify portfolio management, improve decision-making, and strengthen user trust in financial data.

My Role

UI/UX with a strong UI focus.

Definition of core user flows
High-fidelity interface design
Reusable component creation
Development-ready prototypes
Collaboration with product and engineering teams
THE solution

The dashboard was redesigned with a focus on clarity, structure and control, reducing administrative load and enabling better management of critical financial information.

Key design focuses:

Clear visual hierarchy for key data
Consistent and reusable components
Optimized flows for recurring tasks
A trustworthy, decision-oriented interface
THE OUTCOME

A clearer and more structured financial dashboard designed to support daily management, reduce operational friction, and build trust in the presented data.

Results
& Impact

This redesign established the foundation for a more usable, reliable, and scalable financial platform.

01

Optimized flow

Clearer and more efficient administrative processes.

02

Data clarity

Financial information that is easier to read and interpret.

03

User trust

An interface designed to convey confidence and control.

04

Product scalability

A system prepared to support portfolio growth and new clients.

THE CONTEXT

The project aimed to establish an initial B2B digital channel to improve the purchasing experience for retail partners and modernize the sales process.

Process

The process focused on understanding the existing sales flow and translating
it into a clear digital experience, prioritizing simplicity and usability.
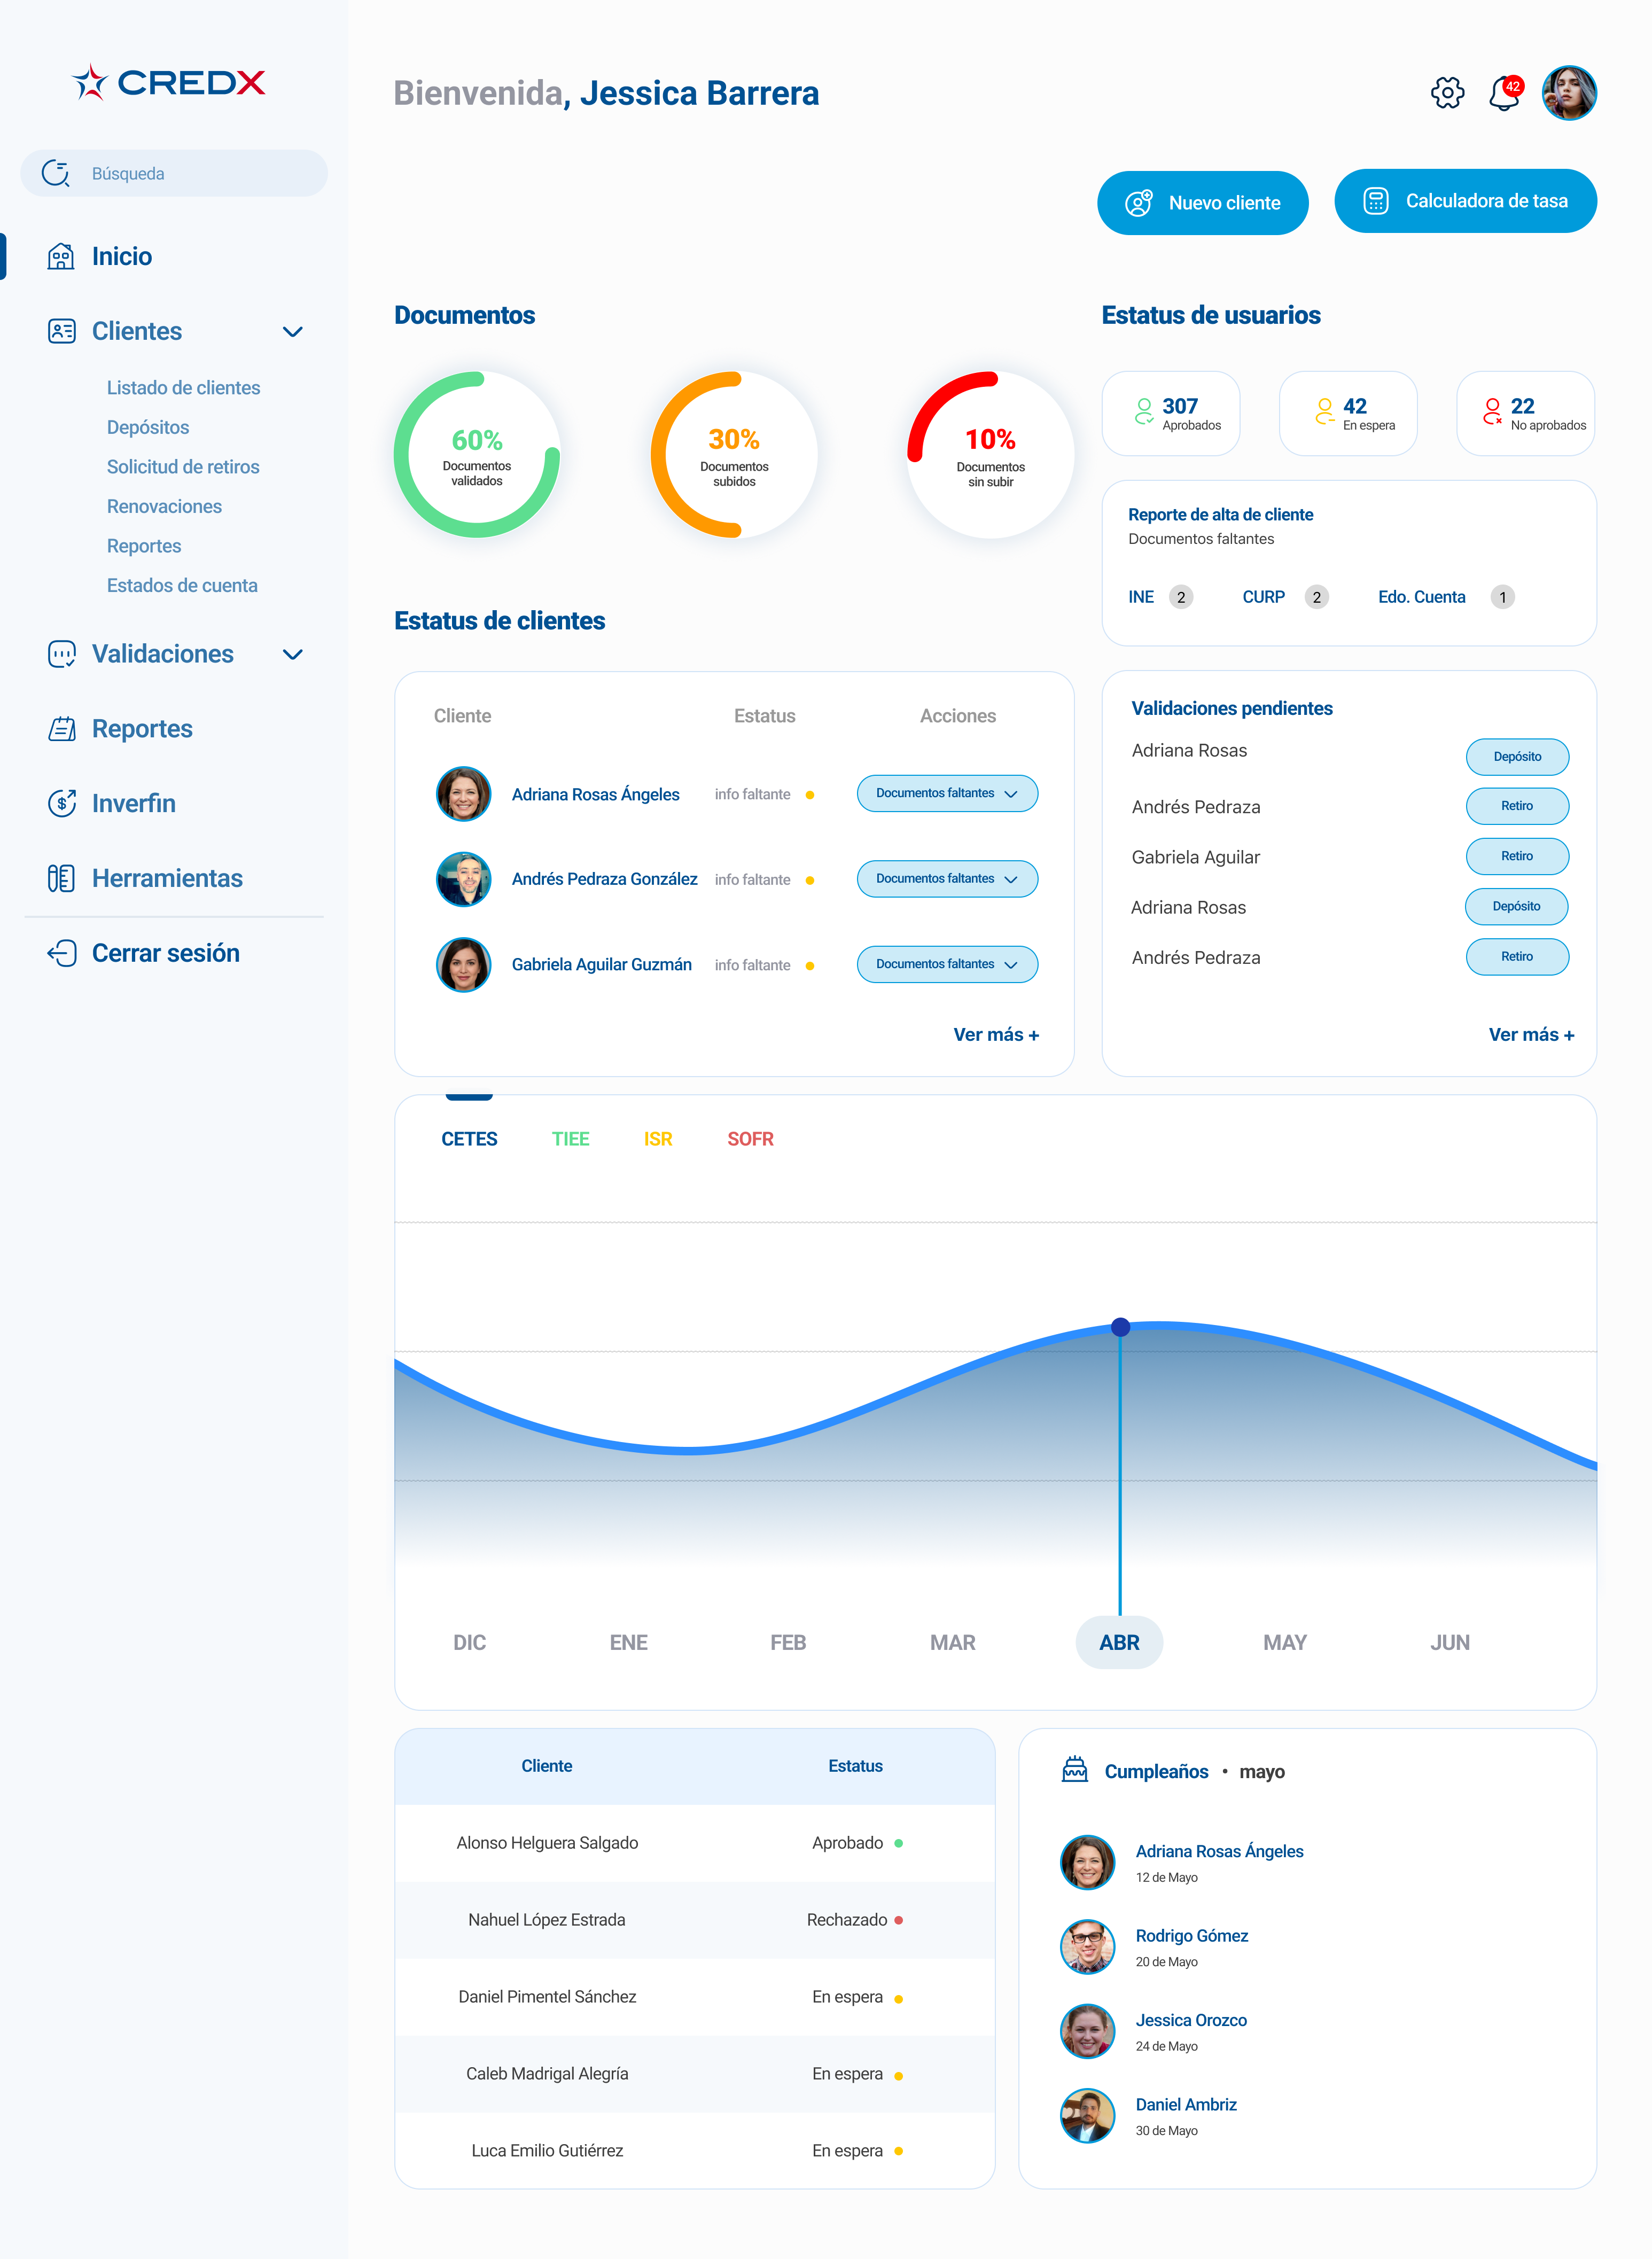
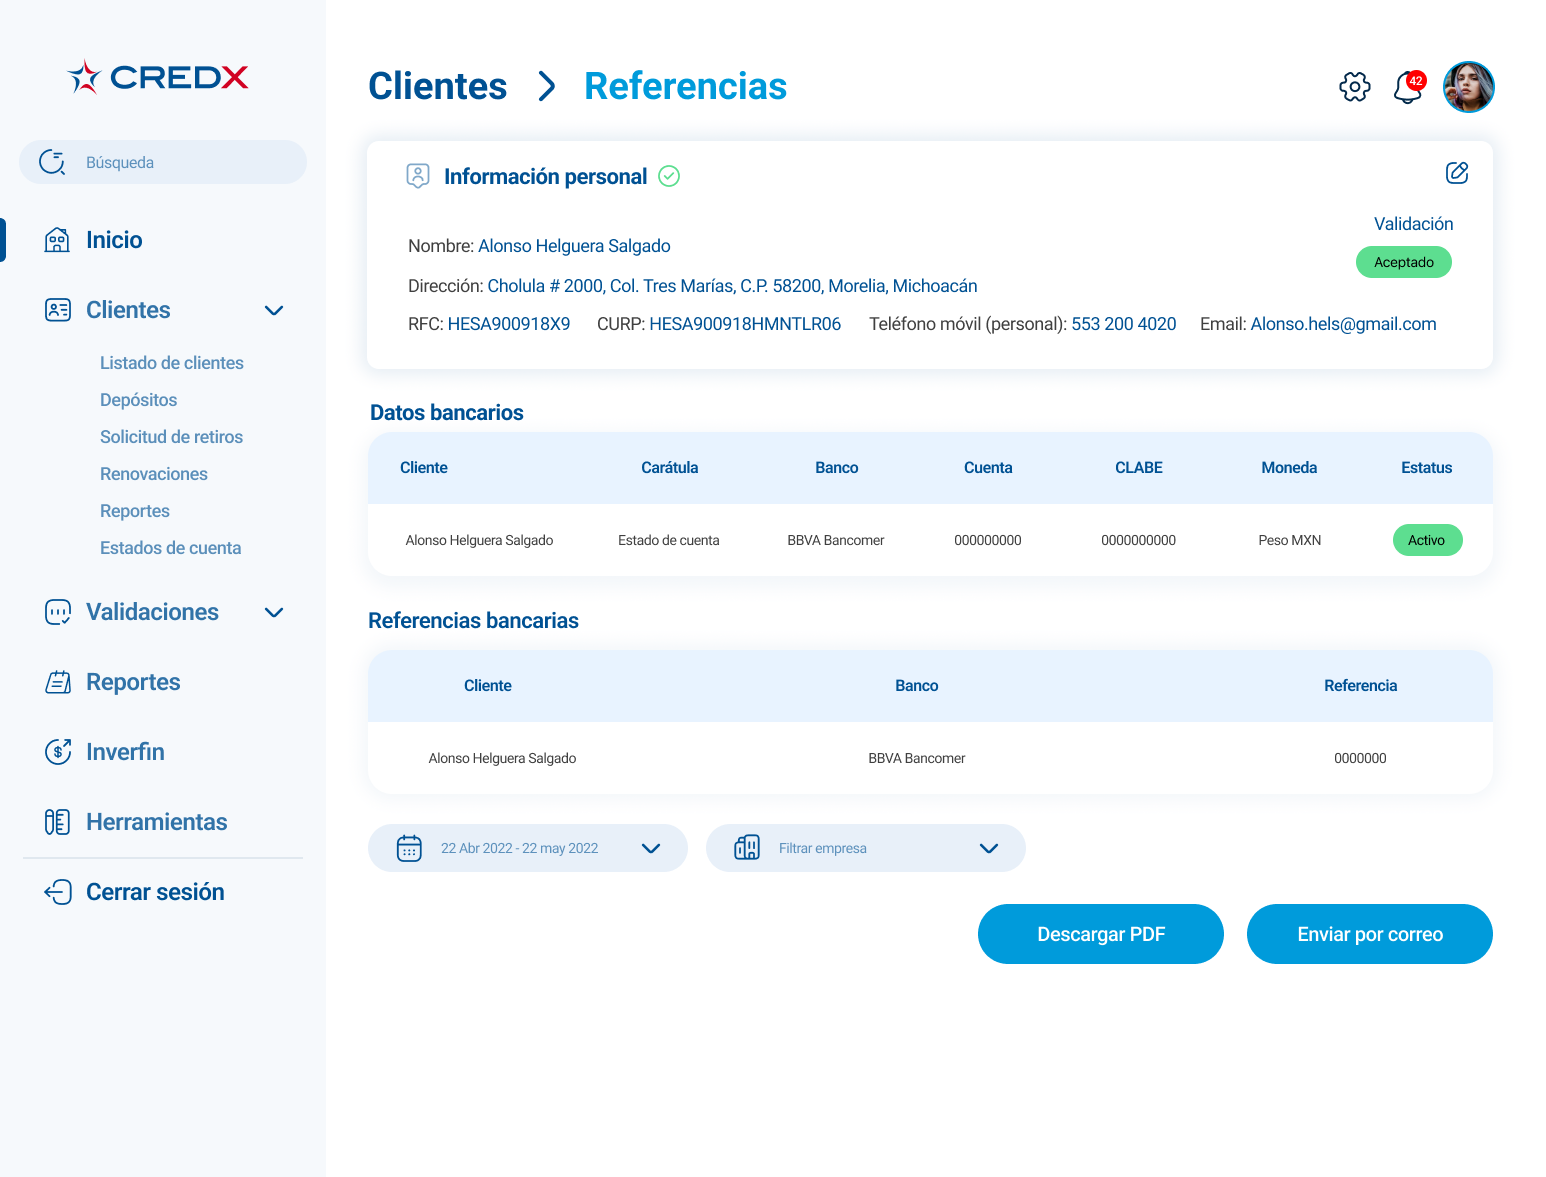
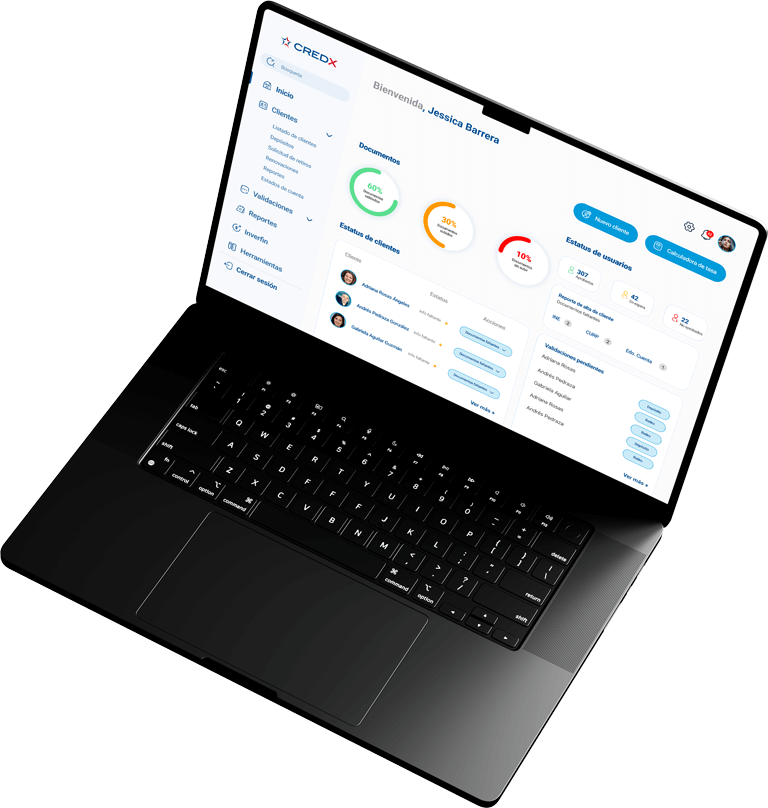
Dashboard flow and
usage analysis
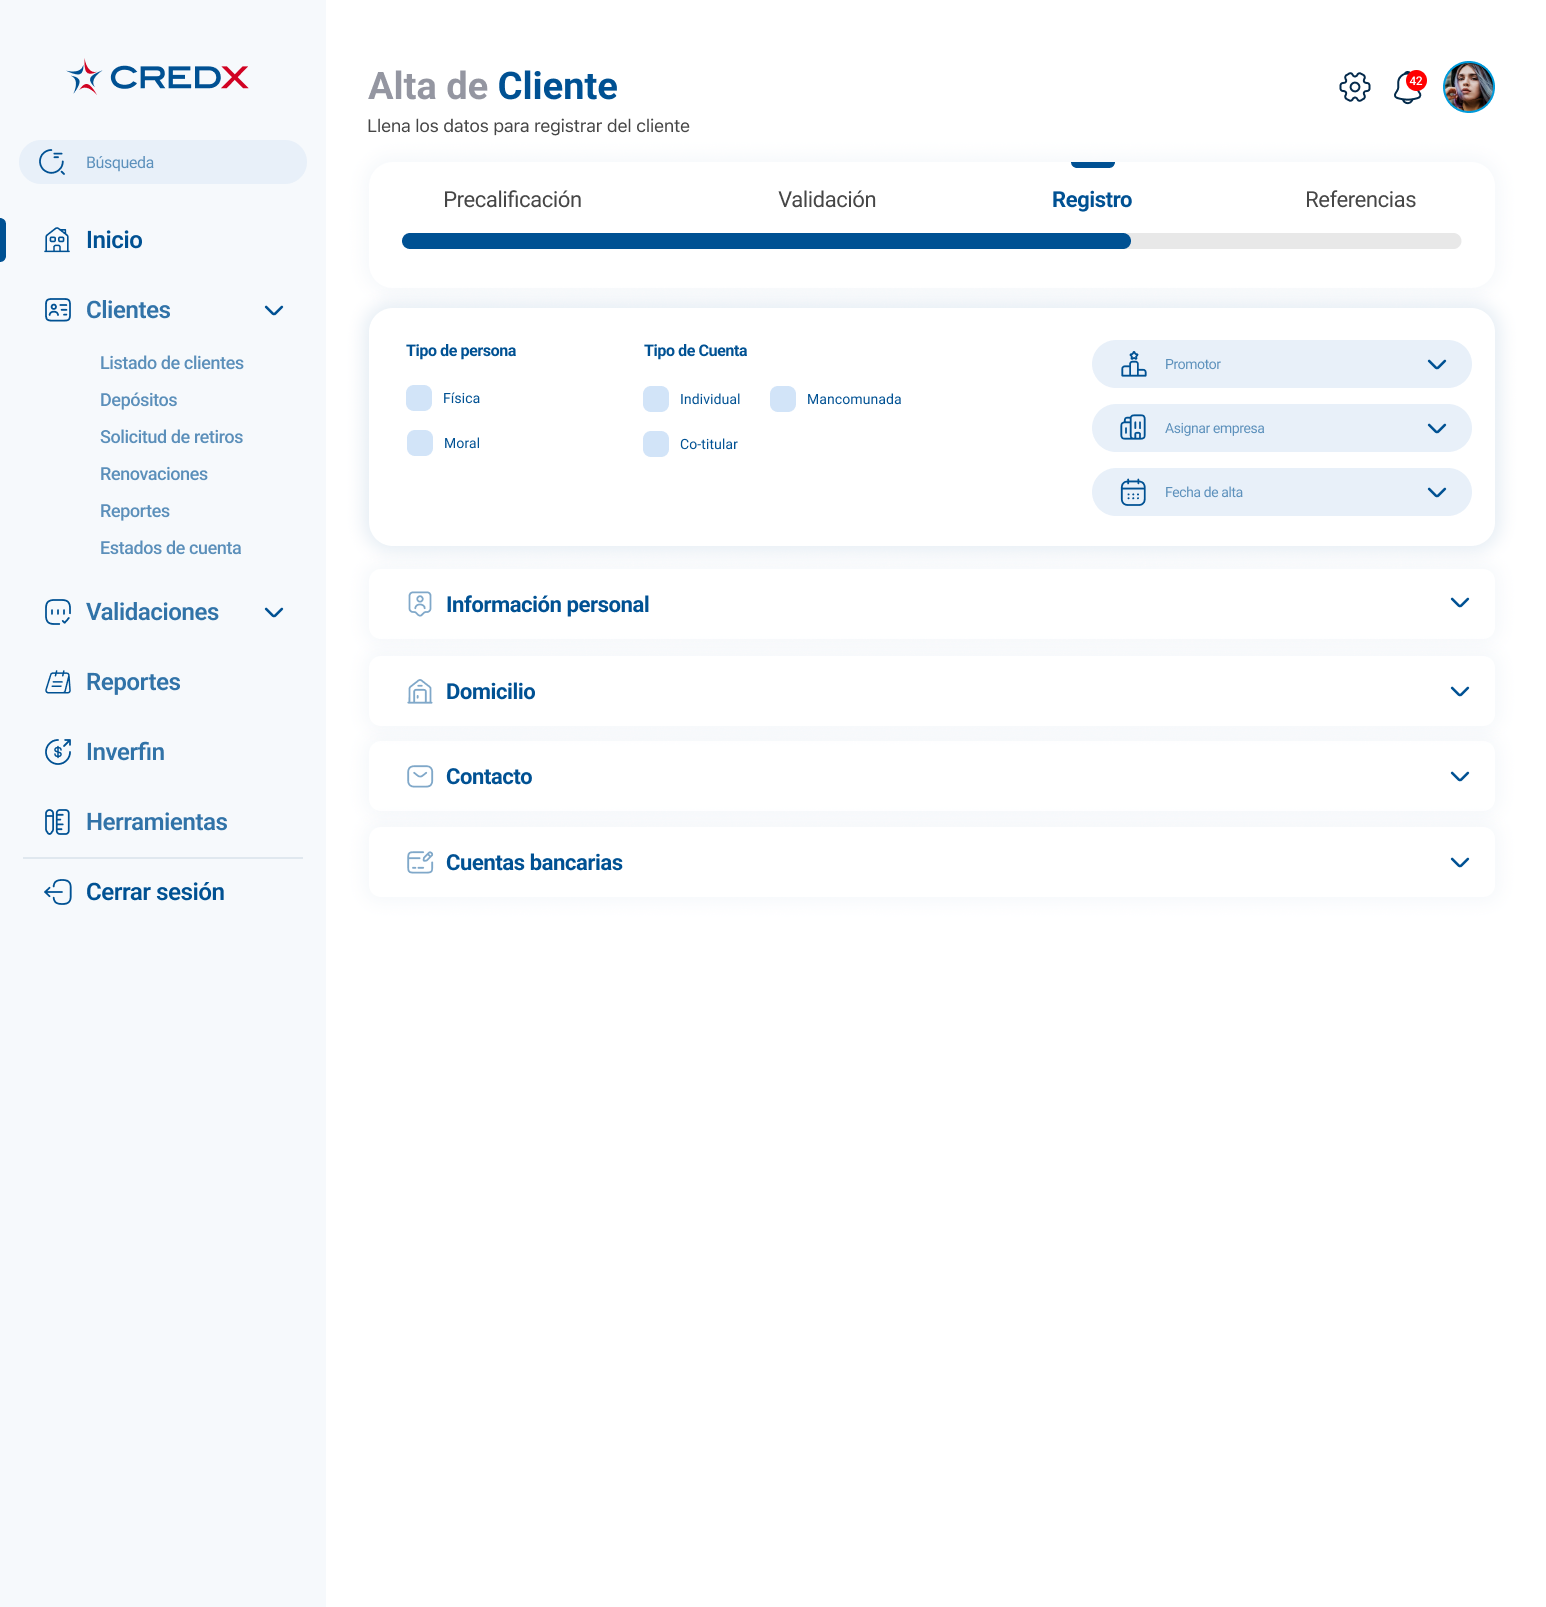
Financial information structure
Reusable component design
Visual iteration on an existing redesign

Design decisions

Design decisions were made with real-world usage in mind, aiming to
reduce complexity and support product adoption.

01

Speed
First
Prioritizing efficiency over visual complexity

02

Data Hierarchy
Highlighting critical information for decision-making

03

System Consistency
Reusable components for coherence and scalability

KEY Learnings

This project reinforced the importance of visual clarity and consistency in financial products, where user trust directly depends on how information is presented.
“Clarity builds trust, especially when data drives decisions”

01

Visual Clarity
Clarity is essential in financial products

02

UI Trust
Strong UI builds confidence and credibility

03

Product Thinking
Designing dashboards requires business and operational thinking

Ready to explore more?

Click to see other case studies.